ARCHICAD provides a simple debugger tool for step-by-step debugging of GDL scripts.
You can see how the instructions are executed one after the other, how the 2D and 3D images are generated line-by-line, and how the values of the variables change.
2D, 3D, Master and Parameter script can be checked this way.
Currently there are two workflows available:
- run the check on an object with its default values (globals are dummy defaults)
- run the check on a placed instance of the object (globals are copied from the current environment)
The debugger tool executes the GDL script in an isolated environment: this means requests are not returning valid values, and global values may change according to the chosen workflow. Please, keep this in mind when using the tool.
The Debugger is available on both Windows and OSX platforms.
Accessing the GDL Debugger tool
- Open the library part you want to debug for editing. Make sure the focus is on the GDL editor window, otherwise you will not get the new option in Edit menu.
- Go to the “Edit / Open Debugger” menu item.

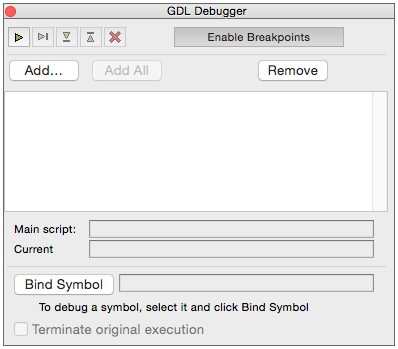
Layout of the Debugger window
Control buttons:
Other Functions:
- Enable Breakpoints: if this option is switched OFF, the BREAKPOINT instructions placed in your script will have no effect.
Note: if Enable Breakpoints option is ON, BREAKPOINT instructions will break the execution of Run and Step Out commands: you can continue the step-by-step debugging from after the BREAKPOINT instruction. - Watch list: shows the current vales of the listed variables. To edit the list of variables, click on a variable’s name, or use the Add / Remove buttons.
- Bind Symbol: the GDL Debugger can observe one placed object. This allows you to debug what is happening inside that specific object’s scripts.
Note: the script is still running in an isolated environment this case, so requests do not work properly. Only the parameters and GDL Globals are reused from the object’s original script execution.
Debugging example
Example:
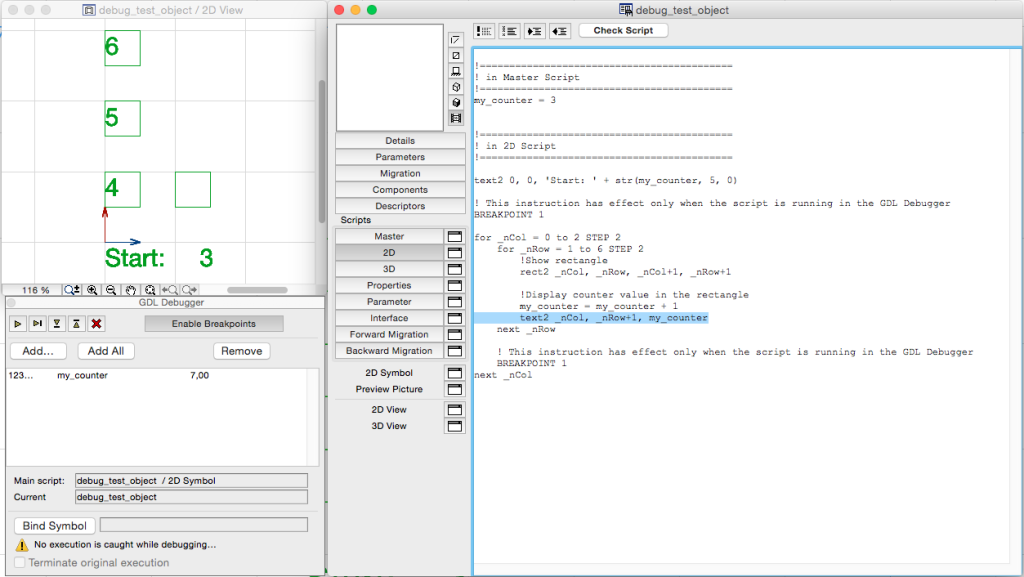
let’s say you would like to see what is happening inside the 2D script of this simple Library Part:
!===========================================
! in Master Script
!===========================================
my_counter = 3

!===========================================
! in 2D Script
!===========================================
text2 0, 0, 'Start: ' + str(my_counter, 5, 0)

! This command has effect only in GDL Debugger
BREAKPOINT 1

for _nCol = 0 to 2 STEP 2
	for _nRow = 1 to 6 STEP 2
		!Show rectangle
		rect2 _nCol, _nRow, _nCol+1, _nRow+1

		!Display counter value in the rectangle
		my_counter = my_counter + 1
		text2 _nCol, _nRow+1, my_counter
	next _nRow

	! This command has effect only in GDL Debugger
	BREAKPOINT 1
next _nCol
For starters, it is recommended to undock all related tabs, and arrange them on your screen (GDL editor window, 2D view of the debugged object, debugger).

Debugging the Library Part default
- In the LibPart Editor, select the 2D script. This will tell the Debugger that you want to debug the 2D script.
- On the GDL Debugger window, click the Run button. After this, the control buttons next to the Run button are enabled. This shows that you have started debugging the script.
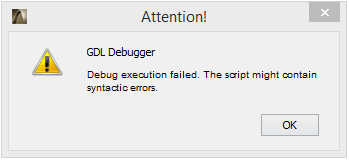
Note: If you have errors in your GDL script, the following message will appear. In this case, please use the Check Script button to find the error.

- Let’s say you want to see how the value of the variable “my_counter” changes. Using the Add button, add this variable to the watchlist (type name, and hit ENTER). At this point, its value is still 0 (since the Master Script was not executed yet).
- Click the Step Over button. The first instruction is executed: it is selected in the script window, and the value of “my_counter” changes to 3.

- Click the Run button. The Debugger automatically executes until it reaches the first BREAKPOINT instruction. You can see the 2D image at the current phase, and the value of “my_counter” (still 3). If there were no BREAKPOINT instructions in the script, it would have run to the last line automatically.
- By continuously clicking Step Over, you can step through the first cycle, and see the incrementally built 2D image. Clicking Run button jumps to the next BREAKPOINT instruction.
- To restart the debugging of the script, click the Cancel icon, and start the debugging again.
Debugging a placed object instance
Script types that can be debugged for placed objects:
- 2D script: select Floor Plan view, and click Rebuild & Regenerate in the menu
- 3D script: select 3D view, and click Rebuild & Regenerate in the menu
- Parameter script: open the Settings Dialog for the placed object, and change any parameters.
Note:
for technical reasons, only the values of those GDL Globals are calculated, which are referenced from the script. This means if you do not use the value of a particular GDL Global in your 2D (or Master) script, it might have a dummy default value during debugging.
Known limitations:
- Only placed objects can be debugged this way: you can not debug what’s happening in a Curtain Wall accessory, or a door leaf, for example.
- If there are several similarly parametered objects, 2D scripts will execute for only one of them. This means, if there are 100 similar chairs on the plan, and you select one of them, you have only 1% chance that the GDL Debugger will be able to catch the selected object’s 2D script execution.
- As mentioned above, requests do not work properly in the GDL Debugger.
Do the following steps:
- Place the library part.
- If the GDL Debugger is not open yet, open it (Edit / Open Debugger).
- Select the placed item on the floorplan, or 3D view. (Since this particular test libpart has no 3D script, it can only be selected on the floorplan view)
- In the Window menu, select the LibPart Editor. This brings up the GDL Debugger window, click Bind Symbol. After clicking it, the name of the selected object will appear next to the button.

- Select the desired script type in the LibPart Editor. (In this example, click on the 2D script button).
Note: At this point, the GDL Debugger is waiting for the selected object’s 2D script to be executed. When it is executed, the GDL Debugger will ask if you want to reproduce the execution in the GDL Debugger. - Click on the floor plan window, and click View / Refresh / Rebuild & Regenerate (shift+ctrl+r) to ensure that the script is executed.
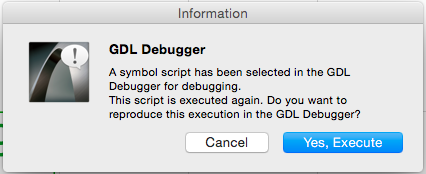
If the binding of the object was successful, a messagebox will appear. Click “Yes, Execute“.

- The GDL Debugger starts the debugging of the scripts, using the same GDL Globals and parameters as used in the placed object’s script execution. You can debug the script as described in the previous section.
