Example object can be downloaded here.
In ARCHICAD 20 a new project2 command, the PROJECT2{4} command has been introduced. This command provides the possibility to define multiple cutting planes parallel to the X-Y plane and allowing individual control over the attributes of the displayed slices.
Using this new feature, the floor plan representation of three-dimensional formations (displaying contour lines of a terrain) becomes more simple.
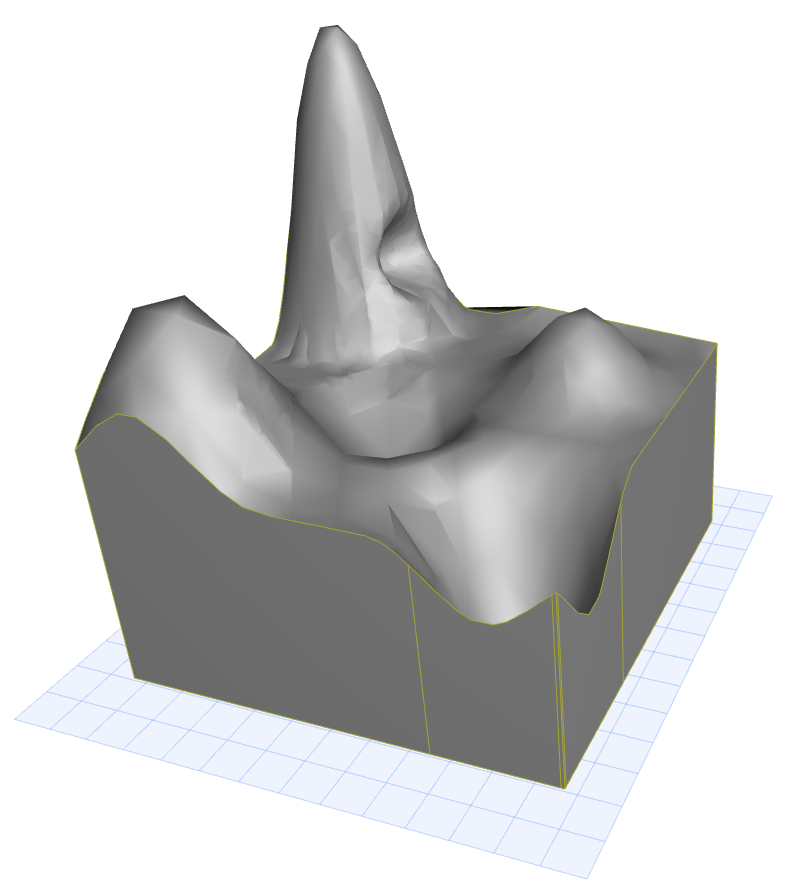
This post presents examples with dynamic cut plane handling: the number of cut planes and the height of the slices can be controlled by the user. The three-dimensional formation is dragged into the 3D script of the object (or it can be imported into GDL from other formats/programs):

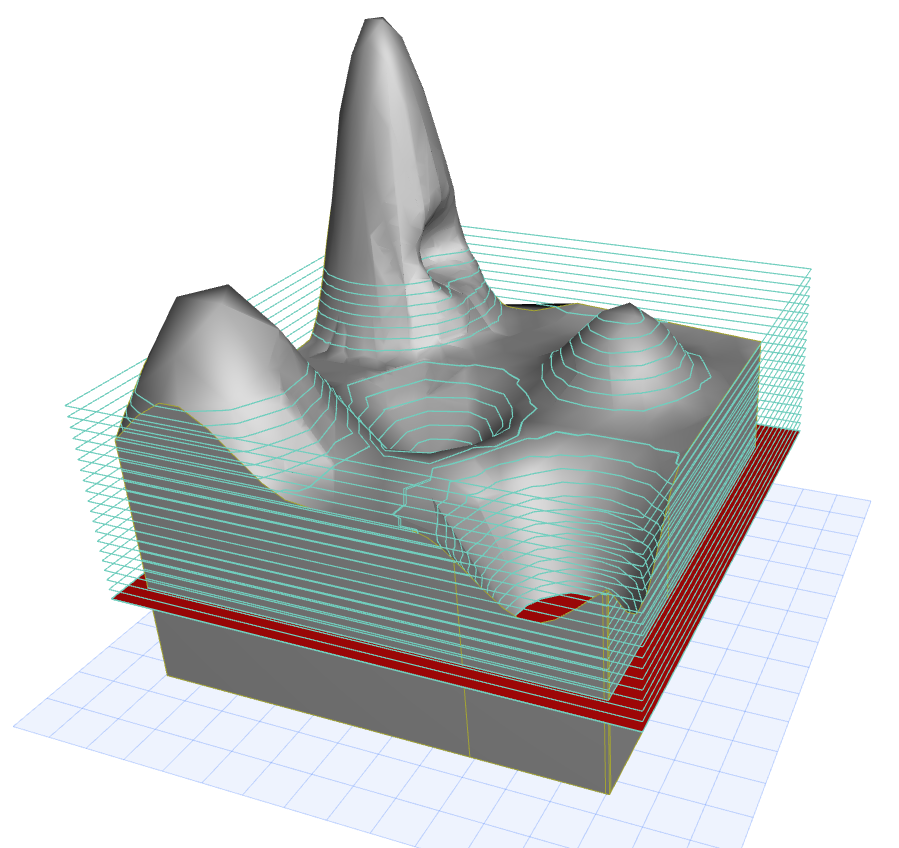
The user can define the number and the height of the slices, and the elevation of the first slice from the bottom of the object (displayed with red plane on the picture):

The first data with dynamic number of parameters in the PROJECT2{4} command is the height of the cutplanes.
Define it in a loop by using Parameter Buffer Manipulation. Each height is calculated from the elevation of the cutting, the slice height and the iteration variable of the loop:
! ------------------------------------------------------------------------------
! Input parameters controlled by the user:
! ------------------------------------------------------------------------------
! iCutPlanes 		- (Integer) Number of the cut planes to display
! cutElevation 		- (Length) Height from the bottom of the object,
!			  where the cutting starts
! sliceHeight		- (Length) The height of each slices

for i = 1 to iCutPlanes
	put cutElevation + (i-1) * sliceHeight
next i
To display the contour lines of the terrain only without fills, use method 1 (wireframe).
In the next example the 3D attributes are not used in the projected view, therefore the 32 additional modifier (use current attributes instead of 3D attributes) is also used in the method.
When showing the contour lines only, the cut polygon edges need to be displayed, therefore the parts of the planes are defined by the j2 flag with the value of 2.
The cut planes’s methods, parts and fix attribute indices are defined in a loop by using Parameter Buffer Manipulation:
for i = 0 to iCutPlanes
	put 	1+32,		! method
		2,		! parts
		1,		! cutFillIndex
		1,		! cutFillFgPen
		1,		! cutFillBgPen
		0.0,		! cutFillOrigoX
		0.0,		! cutFillOrigoY
		0.0,		! cutFillDirection
		1,		! cutLinePen
		1,		! cutLineType
		1,		! projectedFillIndex
		1,		! projectedFillFgPen
		1,		! projectedFillBgPen
		0.0,		! projectedFillOrigoX
		0.0,		! projectedFillOrigoY
		0.0,		! projectedFillDirection
		1,		! projectedLinePen
		1		! projectedLineType
next i
The PROJECT2{4} command in the example is used with Top view projection code, with a 270° angle, without transparency and status parts. The number of cut planes is set by the "iCutPlanes" parameter, controlled by the user. The parameters of the cut planes are used from the stack:
project2{4} 3, 270,		! projection_code, angle
	0,			! useTransparency
	0,			! statusParts
	iCutPlanes,		! numCutplanes
	get (nsp)
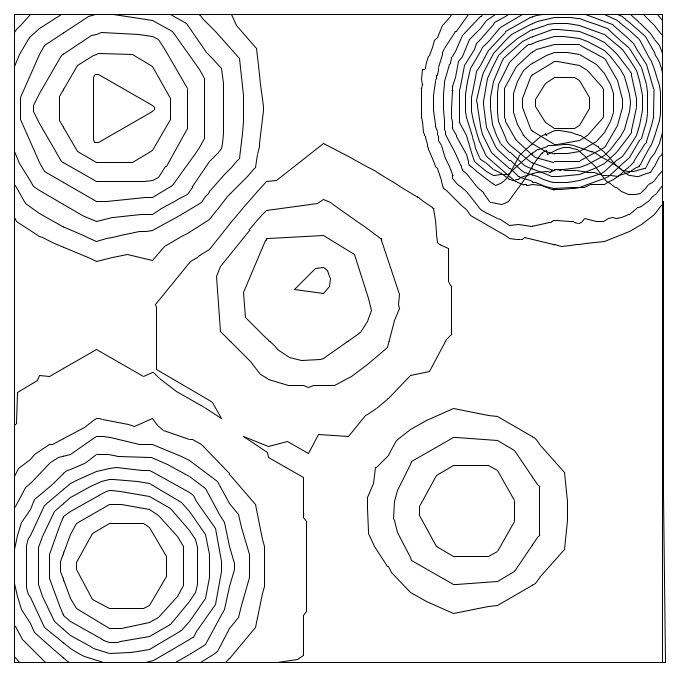
The scripts above result in the following 2D representation:

If a more illustrative representation is required, the script above can be improved to display different fills for the cutplanes alternately.
The method should be changed from 1 (wireframe) to 3 (shading) to display fills.
For the parts, two flags should be added:
j3(value – 4): view polygonsj4(value – 8): view polygon edges
To control the fill pens, two Pen parameters are available for the user: "fillPen1", "fillPen2".
In the loop of the cutplane attributes every even cutplane index is displayed with fillPen1 Foreground and Background Pen, the odd indices are displayed with fillPen2 Foreground and Background Pen:
for i = 0 to iCutPlanes
	put 	3+32,				! method
		2+4+8,				! parts
		1,				! cutFillIndex
		1,				! cutFillFgPen
		1,				! cutFillBgPen
		0.0,				! cutFillOrigoX
		0.0,				! cutFillOrigoY
		0.0,				! cutFillDirection
		1,				! cutLinePen
		1,				! cutLineType
		1,				! projectedFillIndex
		! projectedFillFgPen
		(i mod 2 = 0) * fillPen1 + (i mod 2 = 1) * fillPen2,
		! projectedFillBgPen
		(i mod 2 = 0) * fillPen1 + (i mod 2 = 1) * fillPen2,
		0.0,				! projectedFillOrigoX
		0.0,				! projectedFillOrigoY
		0.0,				! projectedFillDirection
		1,				! projectedLinePen
		1				! projectedLineType
next i
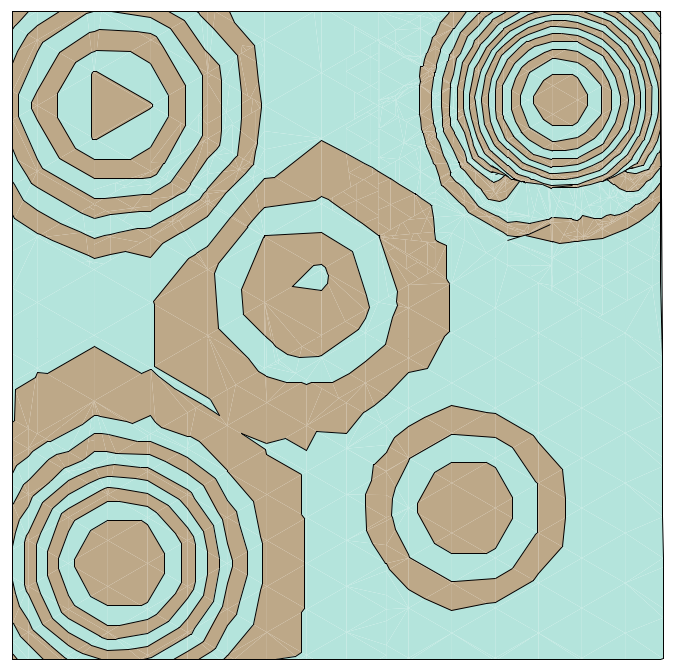
The scripts above result the following 2D representation:
